Module 07

Connectomics → Tractography → Volume of Tissue Activated

Slides 31–35 | From targeting anatomical structures to understanding the networks and pathways actually engaged by stimulation

Original lecture slides 31–35 · Module 07 / 10

“Where the lead is placed is only the beginning. The therapeutic question is which neural elements and networks are actually being modulated.”

From coordinates to circuits

  1. 01COORDINATES
  2. 02ANATOMY
  3. 03LEAD LOCATION
  4. 04CONTACT CONFIGURATION
  5. 05ELECTRIC FIELD
  6. 06VTA
  7. 07FIBRE PATHWAYS
  8. 08NETWORK
  9. 09CLINICAL PHENOTYPE
  10. 10OUTCOME

Modern DBS targeting is moving from coordinates and nuclei toward patient-specific circuits, pathways and stimulation fields — as a complement to, not a replacement for, conventional anatomical targeting.

Learning objectives

By the end of this module you should be able to

  1. 01Trace the evolution from coordinate targeting to network-level thinking
  2. 02Explain why the stimulated tissue is not necessarily the entire therapeutic circuit
  3. 03Contrast anatomical and network targeting as complementary approaches
  4. 04Define structural versus functional connectivity
  5. 05Describe the connectomic targeting pipeline and its weakest links
  6. 06Compare normative/atlas connectivity with patient-specific data
  7. 07State why personalized data are not automatically more accurate
  8. 08Interpret a sweet spot as a model-derived, cohort-level construct
  9. 09Explain why discovery is not validation and association is not causation
  10. 10Describe diffusion tractography as inference rather than direct visualization
  11. 11Distinguish the VIM as a nuclear target from the DRT as a pathway concept
  12. 12Apply tractography quality-control criteria before trusting a reconstruction
  13. 13Define the volume of tissue activated as a model-based estimate
  14. 14List the parameters and assumptions that change an estimated VTA
  15. 15Explain why VTA overlap neither guarantees benefit nor excludes effect

Original lecture slides

Slides 31–35

The slides below are reproduced exactly as delivered. Everything outside the slide panel is added study material.

Slide 31

Slide 31

Original lecture slide

100%
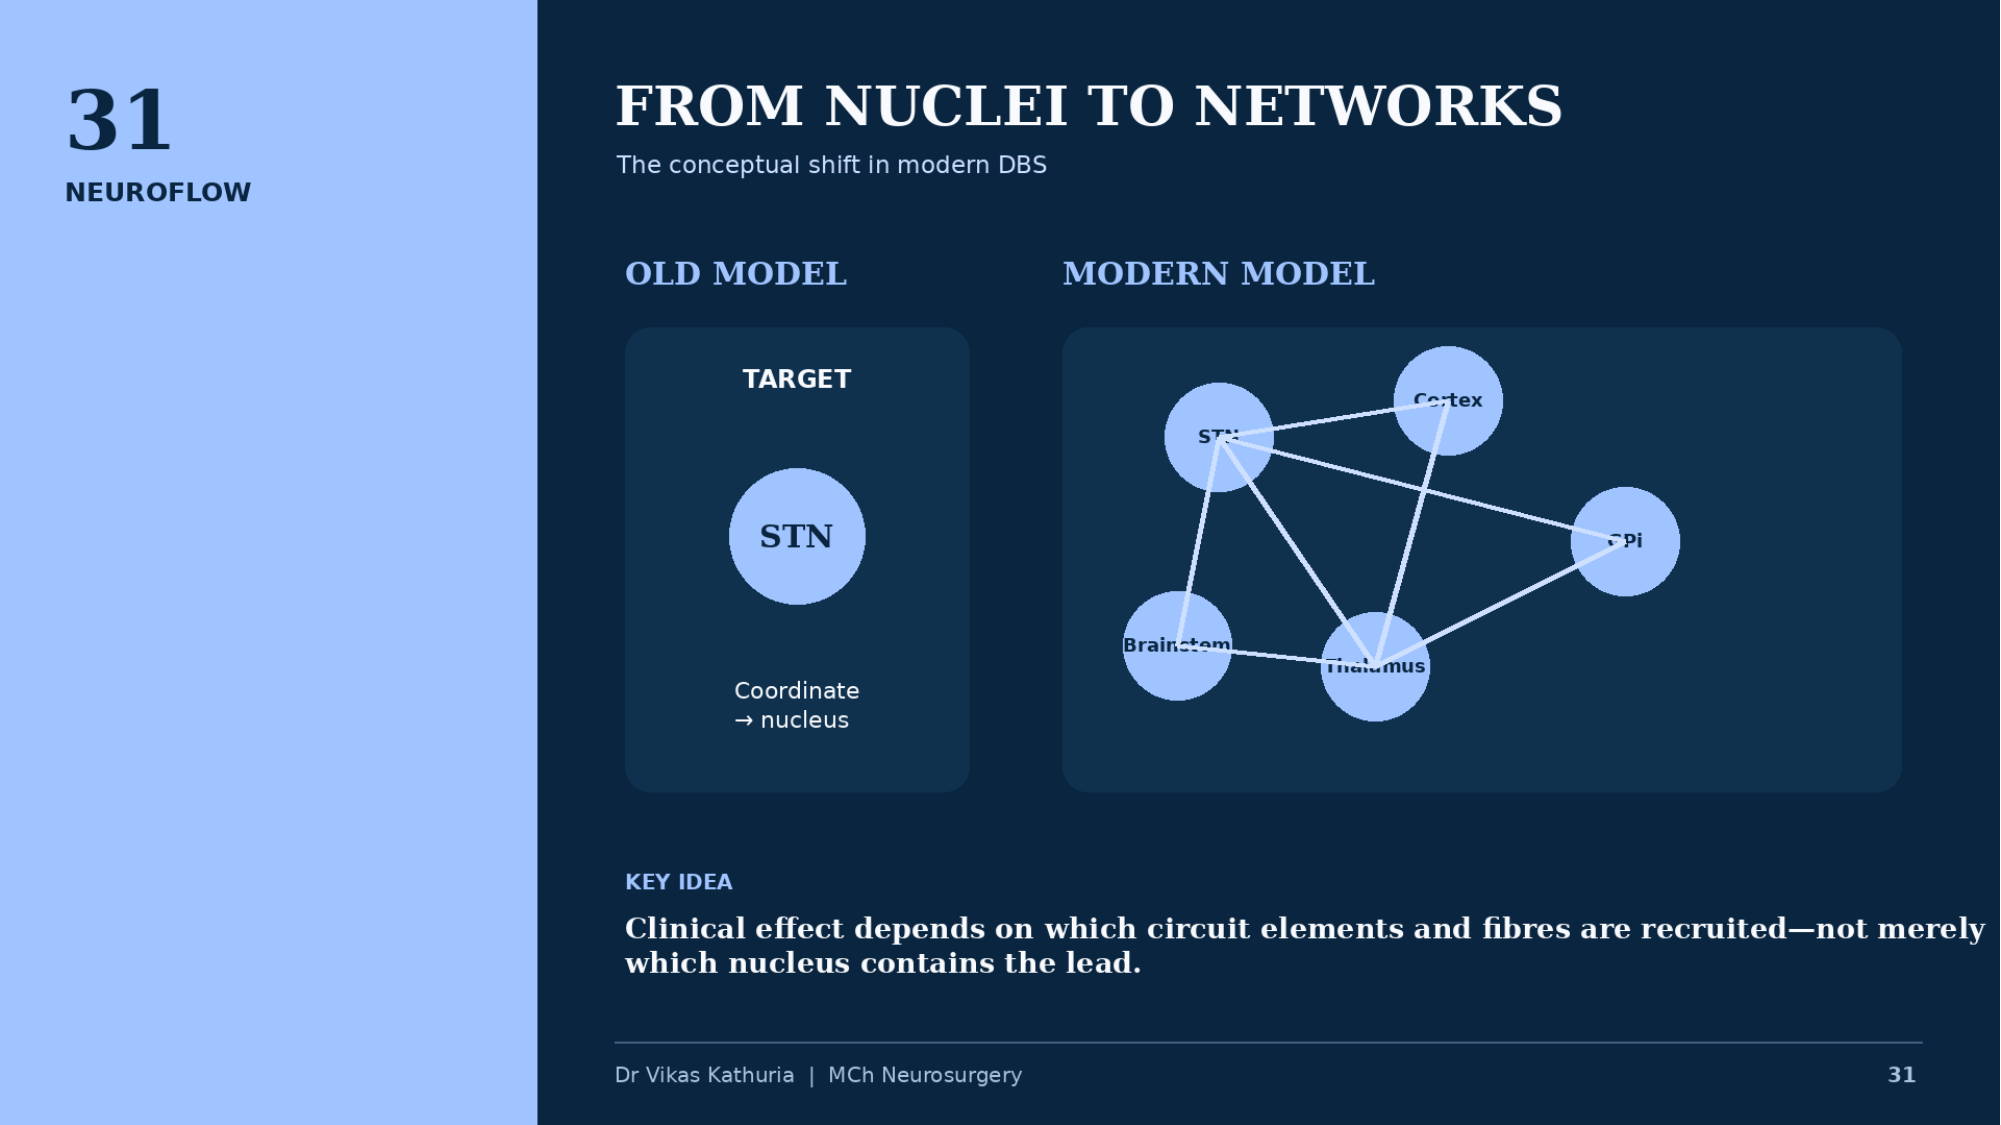
Original lecture slide 31, From nuclei to networks, contrasting an old model targeting the STN as a coordinate with a modern network model linking STN, cortex, GPi, thalamus and brainstem

FROM NUCLEI TO NETWORKS

  • The conceptual shift in modern DBS
  • OLD MODEL
  • TARGET
  • STN
  • Coordinate → nucleus
  • MODERN MODEL
  • STN
  • Cortex
  • GPi
  • Thalamus
  • Brainstem
  • KEY IDEA
  • Clinical effect depends on which circuit elements and fibres are recruited—not merely which nucleus contains the lead.
  • Dr Vikas Kathuria | MCh Neurosurgery
Slide 32

Slide 32

Original lecture slide

100%
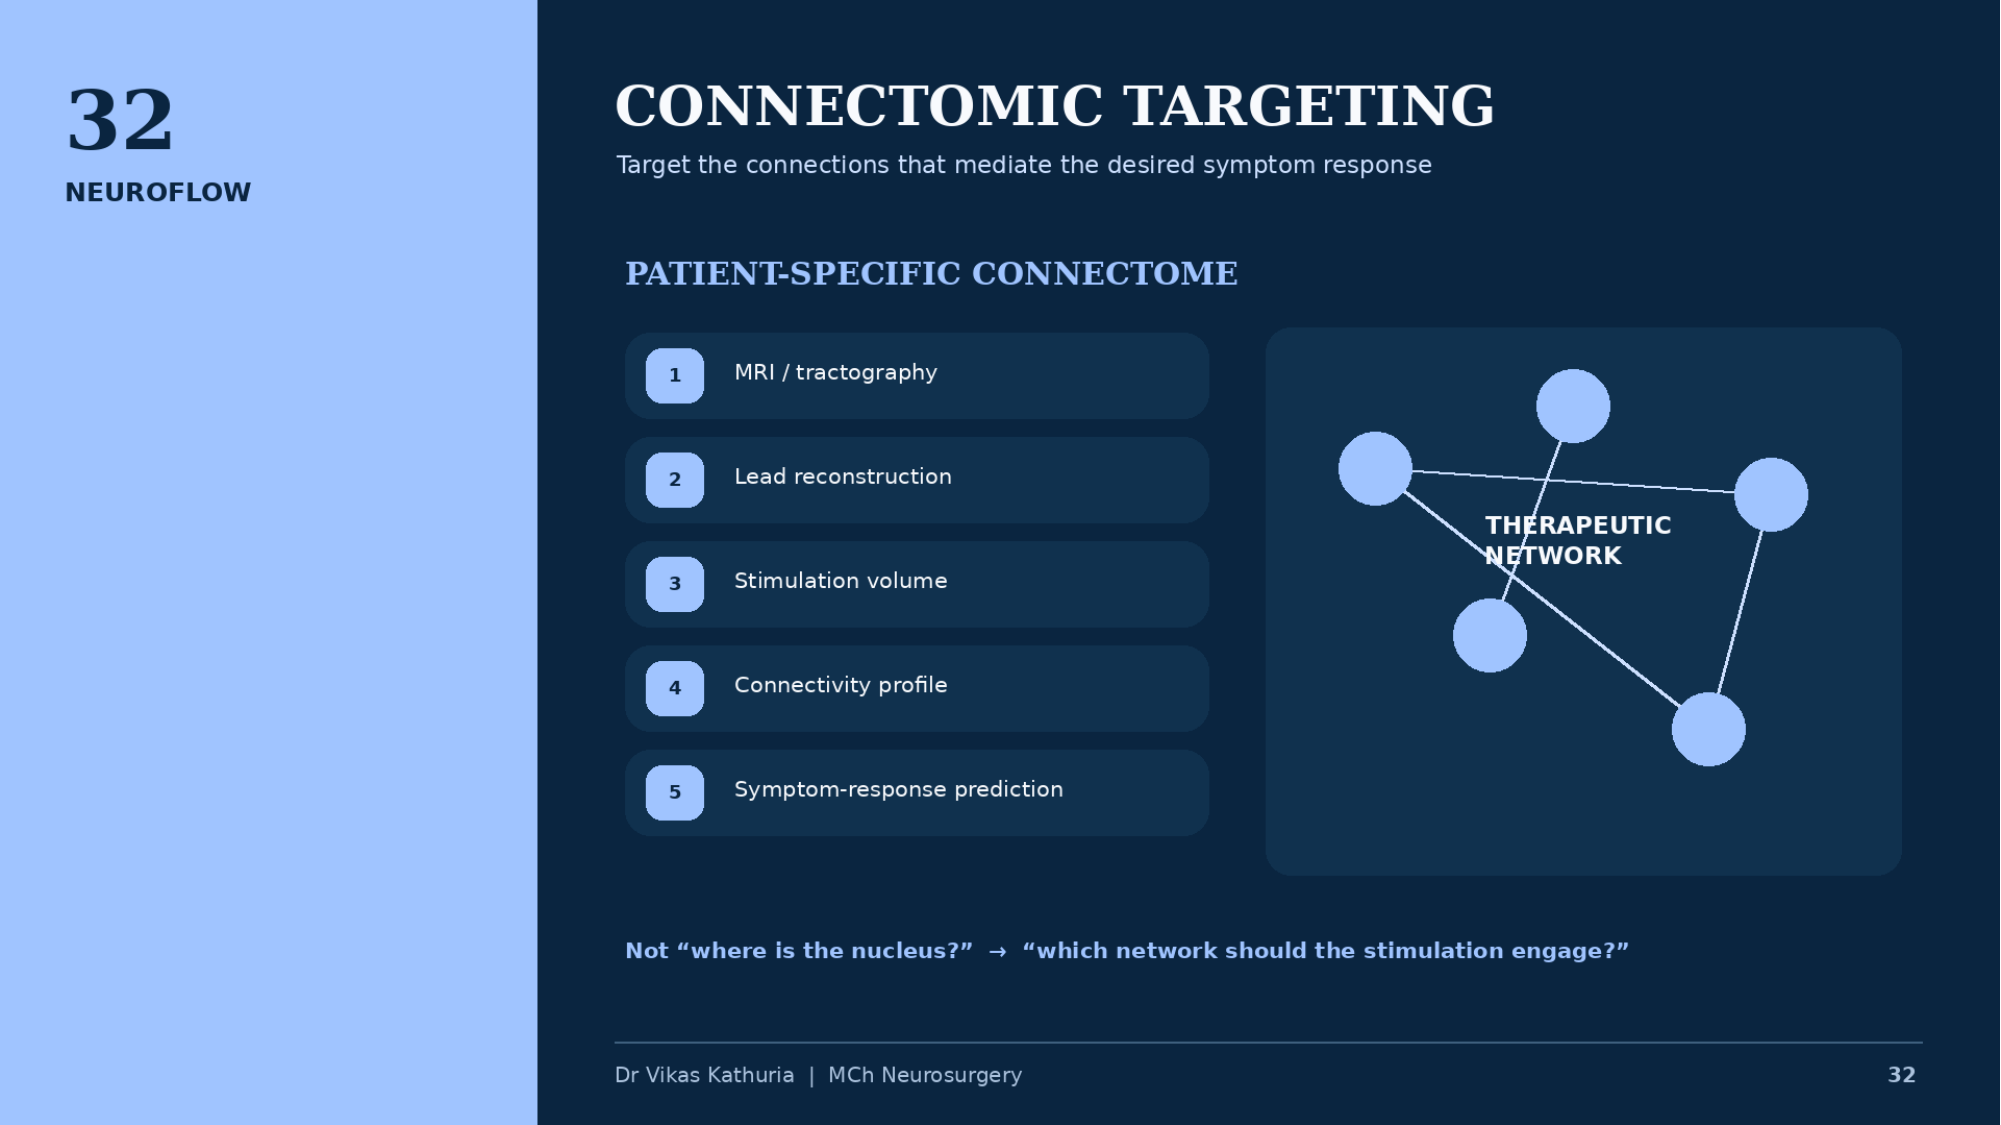
Original lecture slide 32, Connectomic targeting, listing a five-step patient-specific connectome workflow beside a therapeutic network schematic

CONNECTOMIC TARGETING

  • Target the connections that mediate the desired symptom response
  • PATIENT-SPECIFIC CONNECTOME
  • 1 MRI / tractography
  • 2 Lead reconstruction
  • 3 Stimulation volume
  • 4 Connectivity profile
  • 5 Symptom-response prediction
  • THERAPEUTIC NETWORK
  • Not “where is the nucleus?” → “which network should the stimulation engage?”
  • Dr Vikas Kathuria | MCh Neurosurgery
Slide 33

Slide 33

Original lecture slide

100%
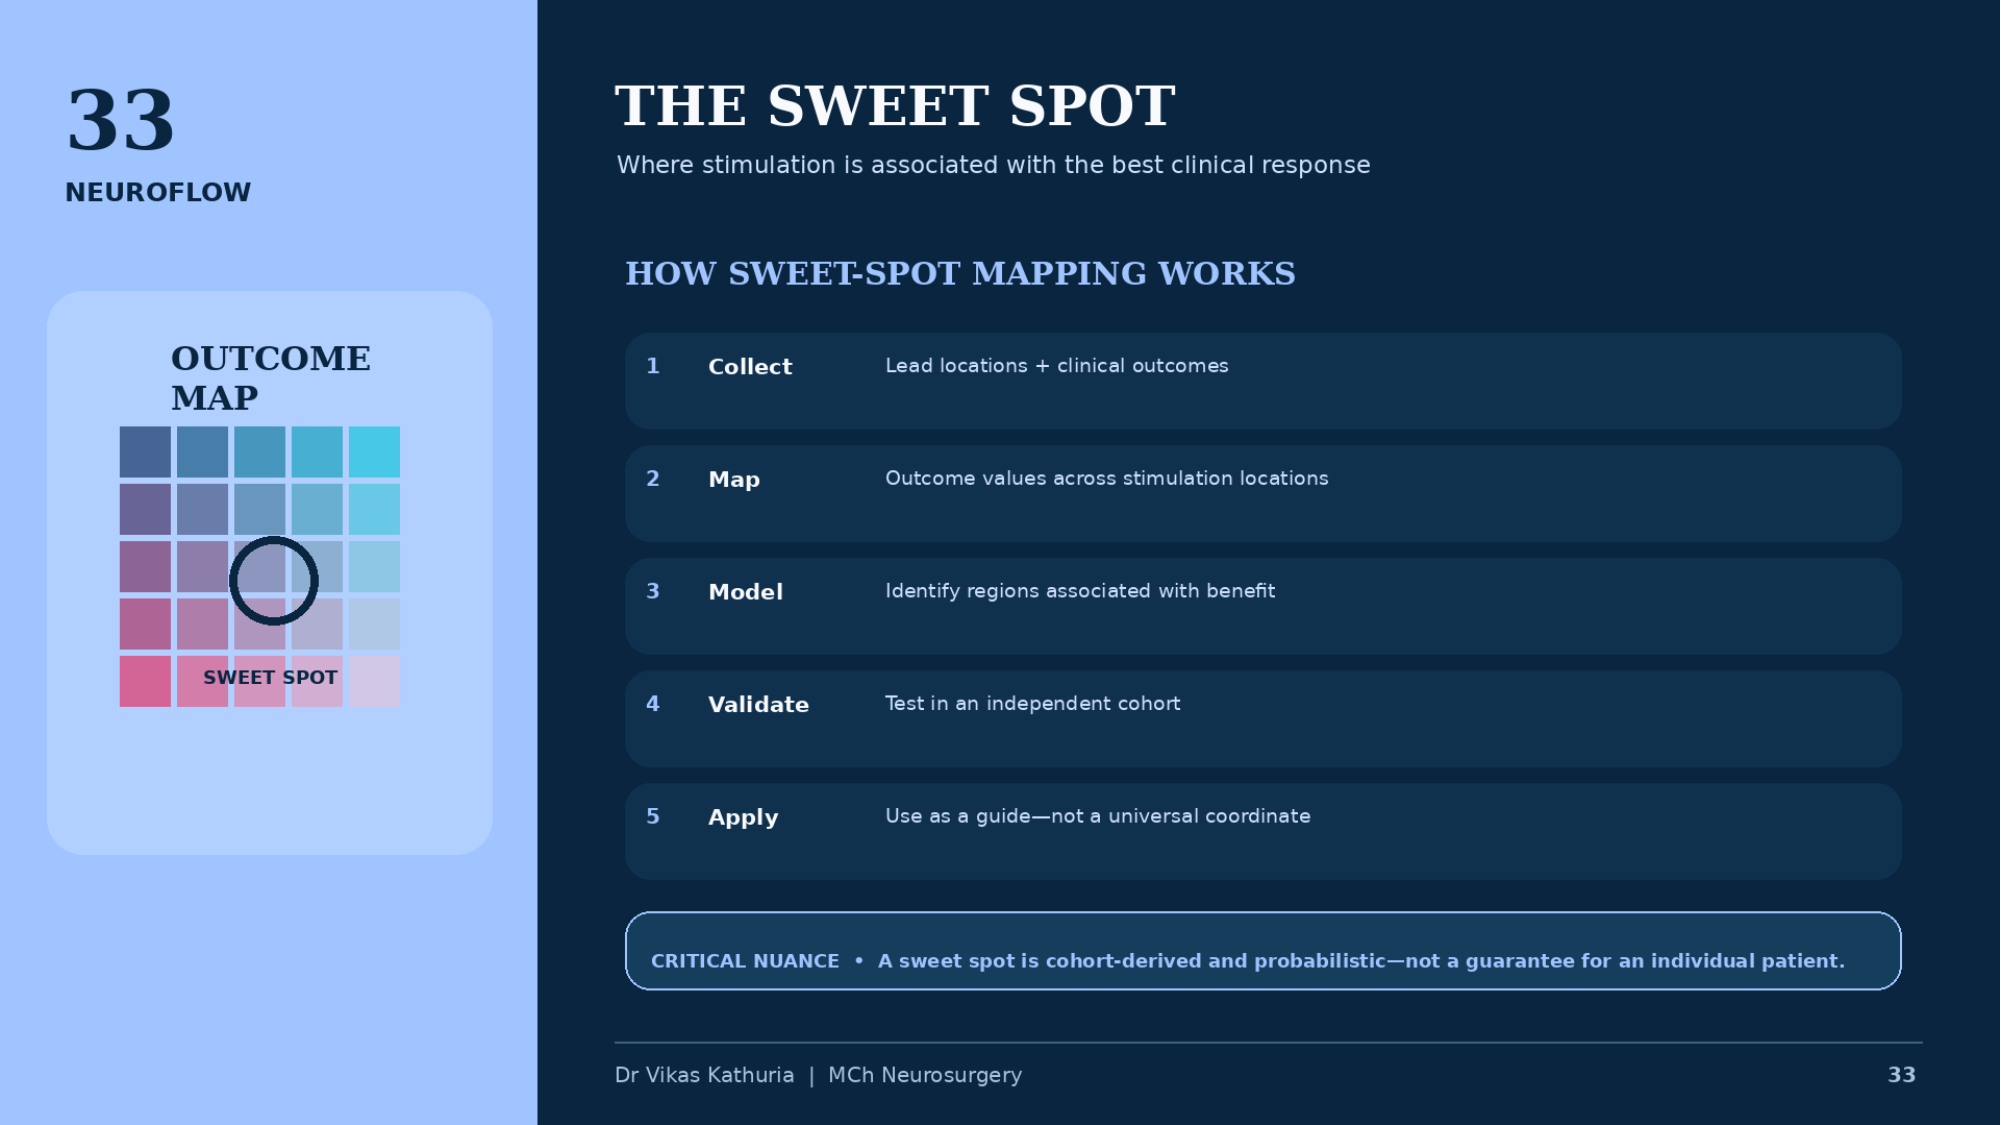
Original lecture slide 33, The sweet spot, showing an outcome map with a marked sweet spot and a five-step description of sweet-spot mapping

THE SWEET SPOT

  • Where stimulation is associated with the best clinical response
  • OUTCOME MAP
  • SWEET SPOT
  • HOW SWEET-SPOT MAPPING WORKS
  • 1 Collect — Lead locations + clinical outcomes
  • 2 Map — Outcome values across stimulation locations
  • 3 Model — Identify regions associated with benefit
  • 4 Validate — Test in an independent cohort
  • 5 Apply — Use as a guide—not a universal coordinate
  • CRITICAL NUANCE • A sweet spot is cohort-derived and probabilistic—not a guarantee for an individual patient.
  • Dr Vikas Kathuria | MCh Neurosurgery

Slide 34

Slide 34

Original lecture slide

100%
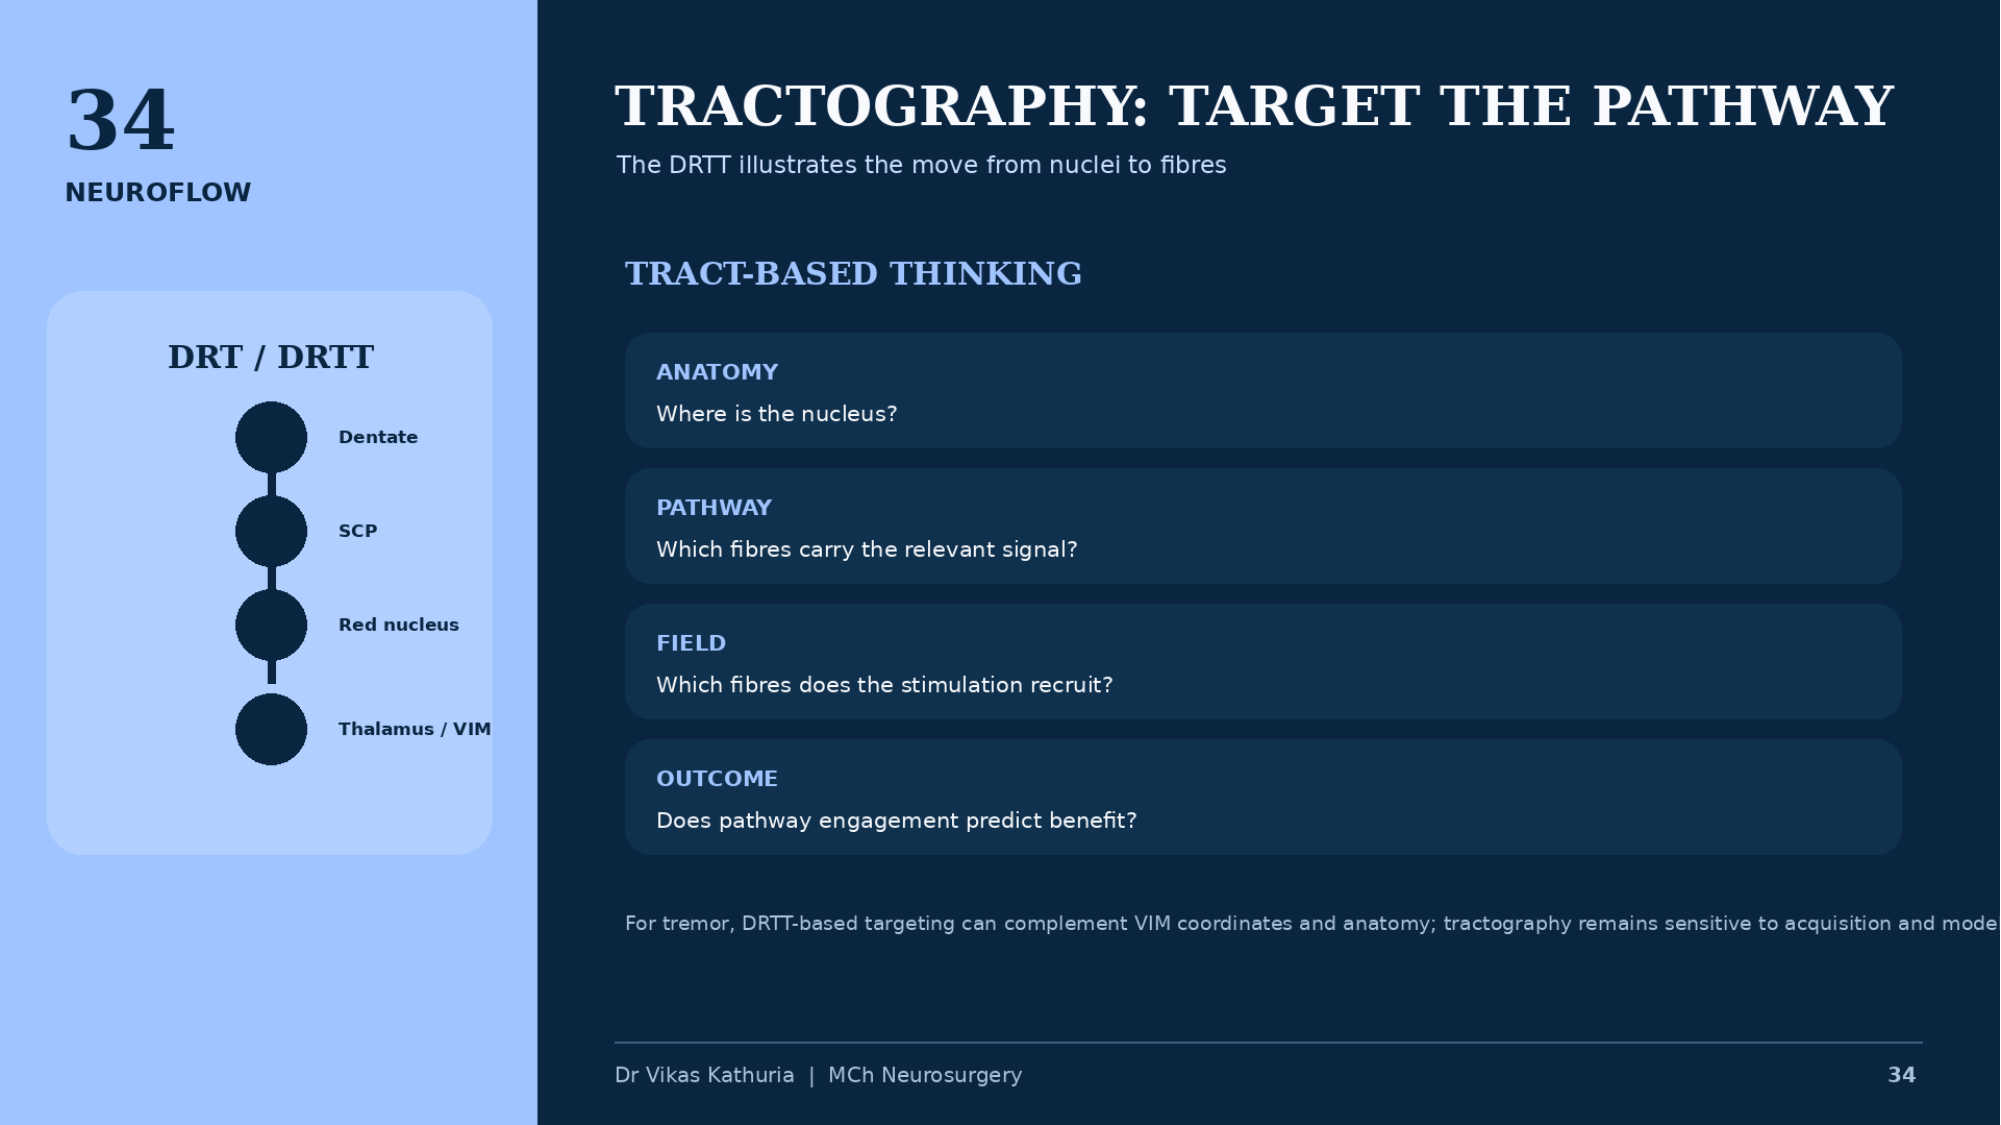
Original lecture slide 34, Tractography: target the pathway, showing the DRT/DRTT from dentate through SCP and red nucleus to thalamus/VIM beside four tract-based questions

TRACTOGRAPHY: TARGET THE PATHWAY

  • The DRTT illustrates the move from nuclei to fibres
  • DRT / DRTT
  • Dentate
  • SCP
  • Red nucleus
  • Thalamus / VIM
  • TRACT-BASED THINKING
  • ANATOMY — Where is the nucleus?
  • PATHWAY — Which fibres carry the relevant signal?
  • FIELD — Which fibres does the stimulation recruit?
  • OUTCOME — Does pathway engagement predict benefit?
  • For tremor, DRTT-based targeting can complement VIM coordinates and anatomy; tractography remains sensitive to acquisition and modelling choices.
  • Dr Vikas Kathuria | MCh Neurosurgery

Slide 35

Slide 35

Original lecture slide

100%
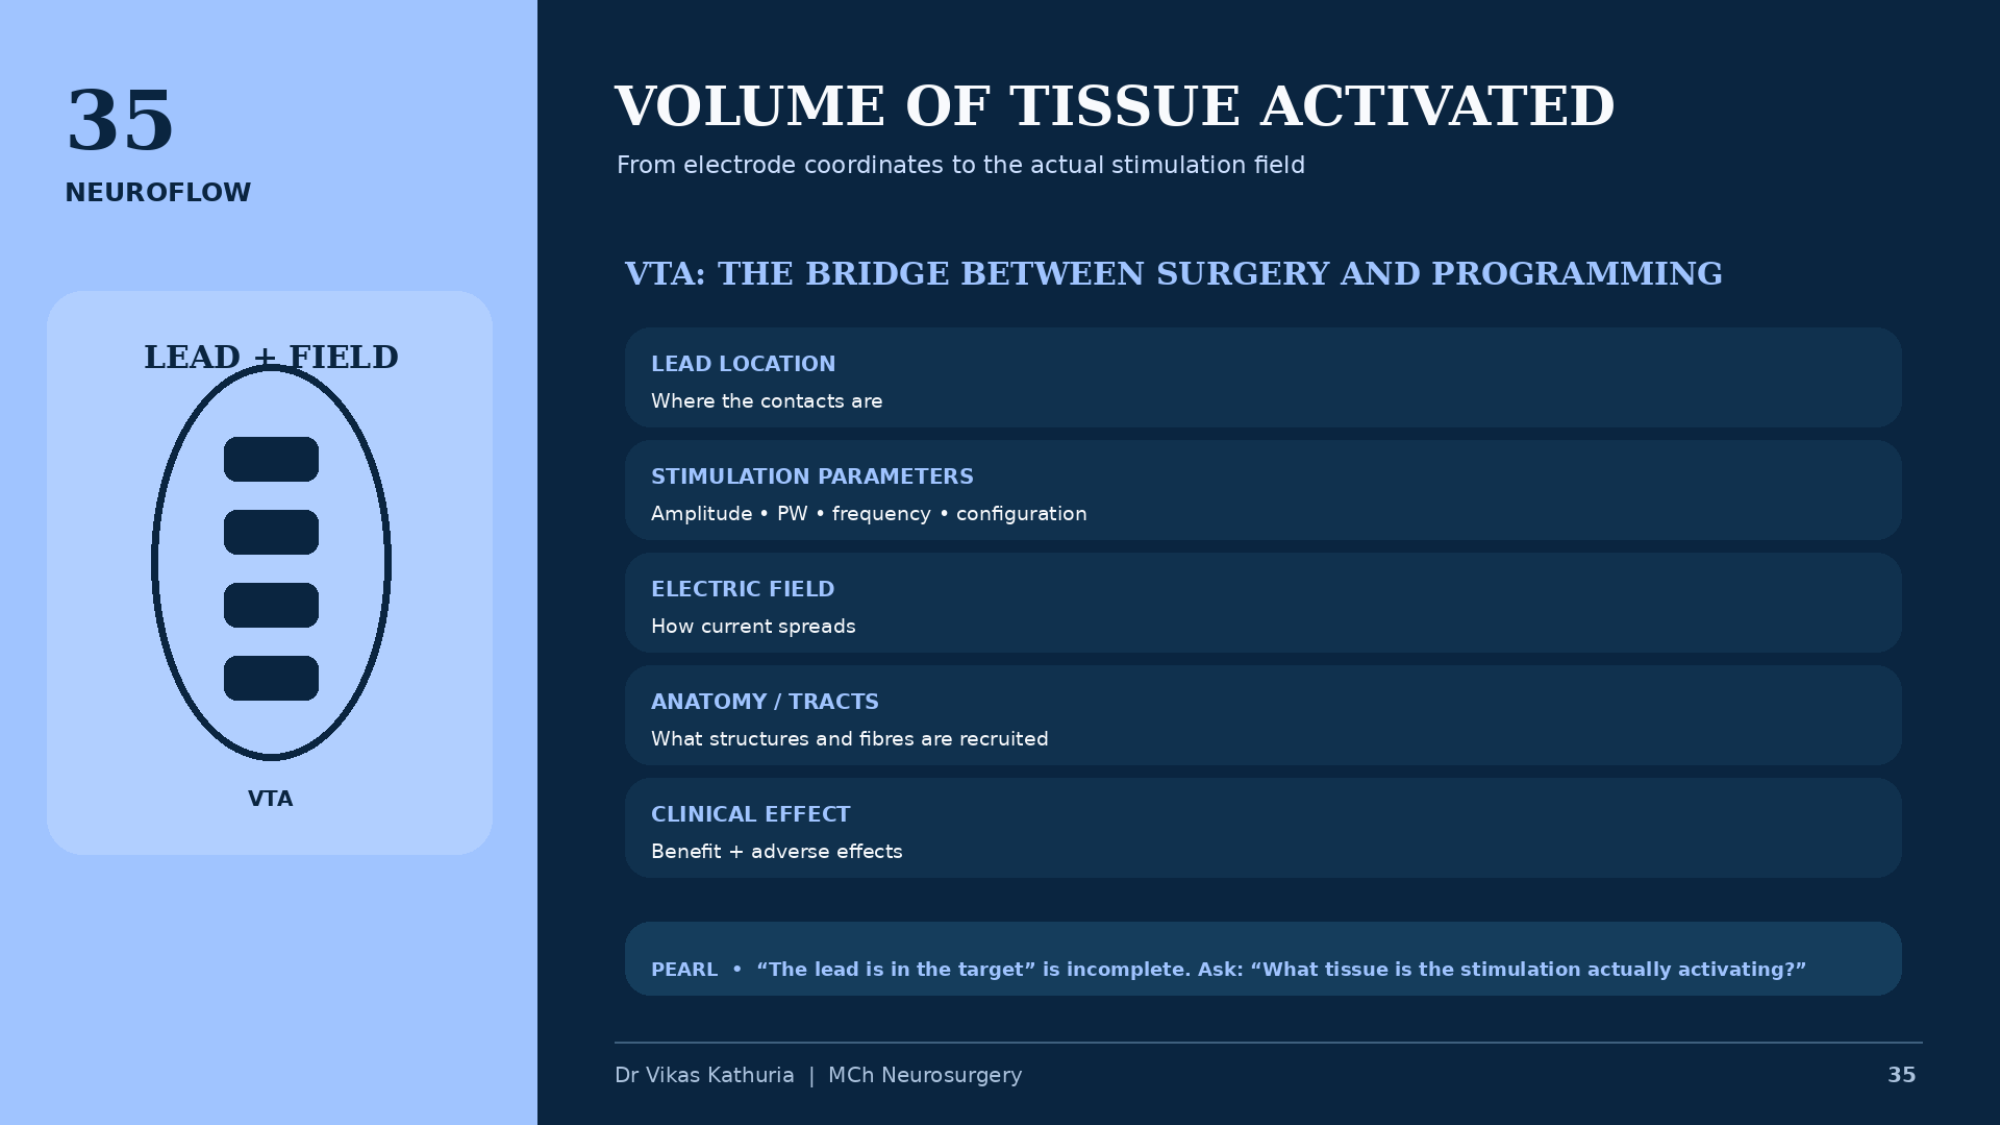
Original lecture slide 35, Volume of tissue activated, showing a lead with four contacts inside a modelled field beside the chain from lead location to clinical effect

VOLUME OF TISSUE ACTIVATED

  • From electrode coordinates to the actual stimulation field
  • LEAD + FIELD
  • VTA
  • VTA: THE BRIDGE BETWEEN SURGERY AND PROGRAMMING
  • LEAD LOCATION — Where the contacts are
  • STIMULATION PARAMETERS — Amplitude • PW • frequency • configuration
  • ELECTRIC FIELD — How current spreads
  • ANATOMY / TRACTS — What structures and fibres are recruited
  • CLINICAL EFFECT — Benefit + adverse effects
  • PEARL • “The lead is in the target” is incomplete. Ask: “What tissue is the stimulation actually activating?”
  • Dr Vikas Kathuria | MCh Neurosurgery

Keyboard: ← previous slide · → next slide · O original slide · S study mode

Expanded study material

Networks, connectivity, sweet spots, tracts and fields

Supplementary material written around the immutable original slides.

Interactive principle

Nucleus view versus network view

Two ways of describing the same implanted lead.

STNCortexGPiThalamusBrainstemNetwork schematic — not a complete connectome

The classical question: where is the target, and which coordinate reaches it? The lead is placed in a nucleus and the nucleus is treated as the therapeutic unit.

The two approaches are complementary. Network reasoning does not reduce the importance of millimetric lead placement — it explains why it matters.

Interactive principle

Connectomic targeting pipeline

Seven steps, each of which can be the weakest link.

Acquisition protocol, diffusion scheme, distortion and motion handling set the ceiling for everything downstream.

Connectomic prediction must be validated against clinical outcome.

Critical thinking

Connectomics is not magic

  • Tractography false positives
  • Tractography false negatives
  • Crossing fibres
  • Resolution limits
  • Registration errors
  • Template mismatch
  • Algorithm dependence
  • Retrospective bias
  • Uncertain causal direction

A beautiful connectivity map is not automatically a validated therapeutic target.

Interactive principle

Sweet-spot mapping

Schematic only — never a reproduction of published patient data.

Schematic · model-derived response map

Overlapping stimulation fields from many patients, weighted by outcome, produce a region of higher response association: the putative sweet spot. The underlying biology may be a pathway or network rather than the region itself.

This is a schematic, not patient data and not a published map. Discovery is not validation; association is not causation.

Interactive principle

Estimated stimulation field

Illustrative model of how amplitude and steering change a modelled field.

Internal capsuleSTNOptic tract

Illustrative model — not patient data

A larger modelled field is not automatically more therapy: it increases the chance of engaging both the intended pathway and adjacent sensitive structures. Steering redistributes the modelled field around the lead without moving it.

In this illustration the modelled field remains away from the adjacent capsular territory.

These relationships are model-dependent and not simple linear rules. VTA overlap does not guarantee benefit, and absence of overlap does not prove absence of effect.

This connects directly to Slide 26 — Directional DBS and Slide 27 — Therapeutic Window.

Decision framework

When should connectivity inform the plan?

Work down the questions; a negative answer is an acceptable endpoint.

Yes
Proceed with standard planning.
No
Additional precision desired — continue to the next question.

Anatomy + phenotype + pathway + field + clinical evidence

Academic caution

Connectomics is a precision tool, not a substitute for clinical reasoning

The surgeon must still understand phenotype, target anatomy, trajectory safety, lead placement, programming, adverse-effect anatomy and disease progression — and must understand the limitations of the imaging model being used.

Cross-links

Where this material connects

Each link opens the related original slide elsewhere in the curriculum.

Future / research direction

Advanced faculty discussion

No definitive answer is offered — this is a debate to hold with your unit.

What will DBS targeting look like in 10 years?

From “where is the lead?” to “what is the lead modulating?”

ANATOMY + PATHWAY + NETWORK + STIMULATION FIELD + PHENOTYPE = PRECISION NEUROMODULATION

Deep study material

Expanded study material

Network-level mechanisms

ESTABLISHED

DBS produces effects that extend beyond simple local neuronal inhibition.

Fibre-mediated and network effects

SUPPORTED

Network-level and fibre-mediated mechanisms are strongly supported by experimental and imaging literature.

Patient-specific connectomic targeting

EMERGING

Connectomic approaches are increasingly supported for understanding symptom-specific circuits and retrospective outcome prediction. Prospective clinical validation and standardized pipelines are still needed before conventional targeting paradigms are displaced.

Tractography in DBS

SUPPORTED

Valuable for research, pathway visualization and increasingly sophisticated planning. Clinical utility varies by target, acquisition protocol, reconstruction method and institutional expertise; it is not mandatory for all DBS procedures.

VTA and image-based lead localization

SUPPORTED

Established research and clinical programming concepts. The VTA remains a computational approximation and should not be read as a direct measurement of neuronal activation.

Anatomy

Anatomy

Expanded study material for this section is written once the original slides for this module are supplied.

Surgical principles

Surgical principles

Expanded study material for this section is written once the original slides for this module are supplied.

Physiology

Physiology

Expanded study material for this section is written once the original slides for this module are supplied.

Imaging

Imaging

Expanded study material for this section is written once the original slides for this module are supplied.

Programming

Programming

Expanded study material for this section is written once the original slides for this module are supplied.

Image placeholders

Images required for this module

Each placeholder states the image type, what is required, why it teaches and where a legitimate source should come from. No clinical image is fabricated.

Image placeholder

MODULE 07 CONNECTOMIC DBS WORKFLOW — INSERT AUTHENTIC IMAGE

Real clinical image required

Image typeSchematic / diagram
DescriptionPublished end-to-end connectomic DBS workflow figure, reproduced with permission.
Clinical purposeSupport fellowship-level interpretation without fabricating imaging or tractography.
Suggested sourceINSERT AUTHENTIC CLINICAL / PUBLISHED IMAGE HERE (licensing confirmed)
Copyright statusSource and reproduction rights must be confirmed before use.
CaptionTo be written with the final image
AssociationModule 07 · Slide 32

Image placeholder

MODULE 07 LEAD RECONSTRUCTION + VTA ATLAS FIGURE — INSERT AUTHENTIC IMAGE

Real clinical image required

Image typeVTA visualization
DescriptionAuthentic reconstruction showing lead, modelled field and neighbouring structures.
Clinical purposeSupport fellowship-level interpretation without fabricating imaging or tractography.
Suggested sourceINSERT AUTHENTIC CLINICAL / PUBLISHED IMAGE HERE (licensing confirmed)
Copyright statusSource and reproduction rights must be confirmed before use.
CaptionTo be written with the final image
AssociationModule 07 · Slide 35

FROM COORDINATES TO CIRCUITS

01

Nuclei to networks

02

Connectomic targeting

03

Sweet spot

04

Tractography

05

Volume of tissue activated

  1. COORDINATES
  2. ANATOMY
  3. LEAD LOCATION
  4. CONTACT CONFIGURATION
  5. ELECTRIC FIELD
  6. VTA
  7. FIBRE PATHWAYS
  8. NETWORK
  9. CLINICAL PHENOTYPE
  10. OUTCOME

THE TARGET IS NOT ONLY WHERE THE LEAD IS. THE TARGET IS WHAT THE STIMULATION ENGAGES.

Clinical pearls

  • DBS is increasingly understood as network modulation, not simply local stimulation.
  • Lead location remains fundamental even when network models are used.
  • A sweet spot is a statistical/model-derived concept, not a universal coordinate.
  • Tractography estimates pathways; it does not directly photograph axons.
  • VTA is a model-based estimate of the stimulation field, not a direct measurement of neuronal activation.

Common errors

  • Presenting connectomic targeting as routine standard of care.
  • Treating a normative connectome as this patient's anatomy.
  • Copying a published sweet-spot coordinate into an individual plan.
  • Conflating the VIM with the DRT.
  • Describing a VTA as the volume of neurons activated.
  • Reading VTA–structure overlap as proof of clinical effect.
  • Letting a tract-derived entry override vascular or sulcal safety.

Take-home message

FROM: “WHERE IS THE LEAD?”TO: “WHAT IS THE LEAD MODULATING?”

  1. ANATOMY
  2. PATHWAY
  3. NETWORK
  4. STIMULATION FIELD
  5. PHENOTYPE
  6. PRECISION NEUROMODULATION

References

Evidence supporting this module

  1. Connectomic deep brain stimulation for neurological and psychiatric disorders. Nat Rev Neurol. 2025. PMID 40903613.
  2. Horn A, Reich M, Vorwerk J, et al. Connectivity predicts deep brain stimulation outcome in Parkinson disease. Ann Neurol. 2017;82(1):67-78.
  3. Horn A, Kühn AA. Lead-DBS: a toolbox for deep brain stimulation electrode localizations and visualizations. Neuroimage. 2015;107:127-135.
  4. Horn A, Li N, Dembek TA, et al. Lead-DBS v2: towards a comprehensive pipeline for deep brain stimulation imaging. Neuroimage. 2019;184:293-316.
  5. Butson CR, Cooper SE, Henderson JM, McIntyre CC. Patient-specific analysis of the volume of tissue activated during deep brain stimulation. Neuroimage. 2007;34(2):661-670.
  6. Butson CR, McIntyre CC. Current steering to control the volume of tissue activated during deep brain stimulation. Brain Stimul. 2008;1(1):7-15.
  7. Dembek TA, Petry-Schmelzer JN, Reker P, et al. PSA and VIM DBS efficiency in essential tremor depends on distance to the dentatorubrothalamic tract. Neuroimage Clin. 2020;26:102235.
  8. McIntyre CC, Savasta M, Kerkerian-Le Goff L, Vitek JL. Uncovering the mechanism(s) of action of deep brain stimulation: activation, inhibition, or both. Clin Neurophysiol. 2004;115(6):1239-1248.
  9. Chiken S, Nambu A. Mechanism of deep brain stimulation: inhibition, excitation, or disruption? Neuroscientist. 2016;22(3):313-322.
  10. Andrade-Souza YM, Schwalb JM, Hamani C, et al. Comparison of three methods of targeting the subthalamic nucleus for chronic stimulation in Parkinson's disease. Neurosurgery. 2005;56(2 Suppl):360-368.
  11. Lahtinen MJ, Haapaniemi TH, Kauppinen MT, Salokorpi N, Heikkinen ER, Katisko JP. A comparison of indirect and direct targeted STN DBS in the treatment of Parkinson's disease—surgical method and clinical outcome over 15-year timespan. Acta Neurochir (Wien). 2020;162(5):1067-1076.

“PRECISION DBS IS NOT SIMPLY MORE PRECISE COORDINATES. IT IS BETTER UNDERSTANDING OF WHERE THE LEAD IS, WHAT FIELD IT CREATES, WHICH FIBRES IT ENGAGES, WHICH NETWORK IT MODULATES, AND WHICH SYMPTOM WE ARE TRYING TO CHANGE.”

Next module · 08Sensing → Adaptive DBS → Future Precision Neuromodulation