100%
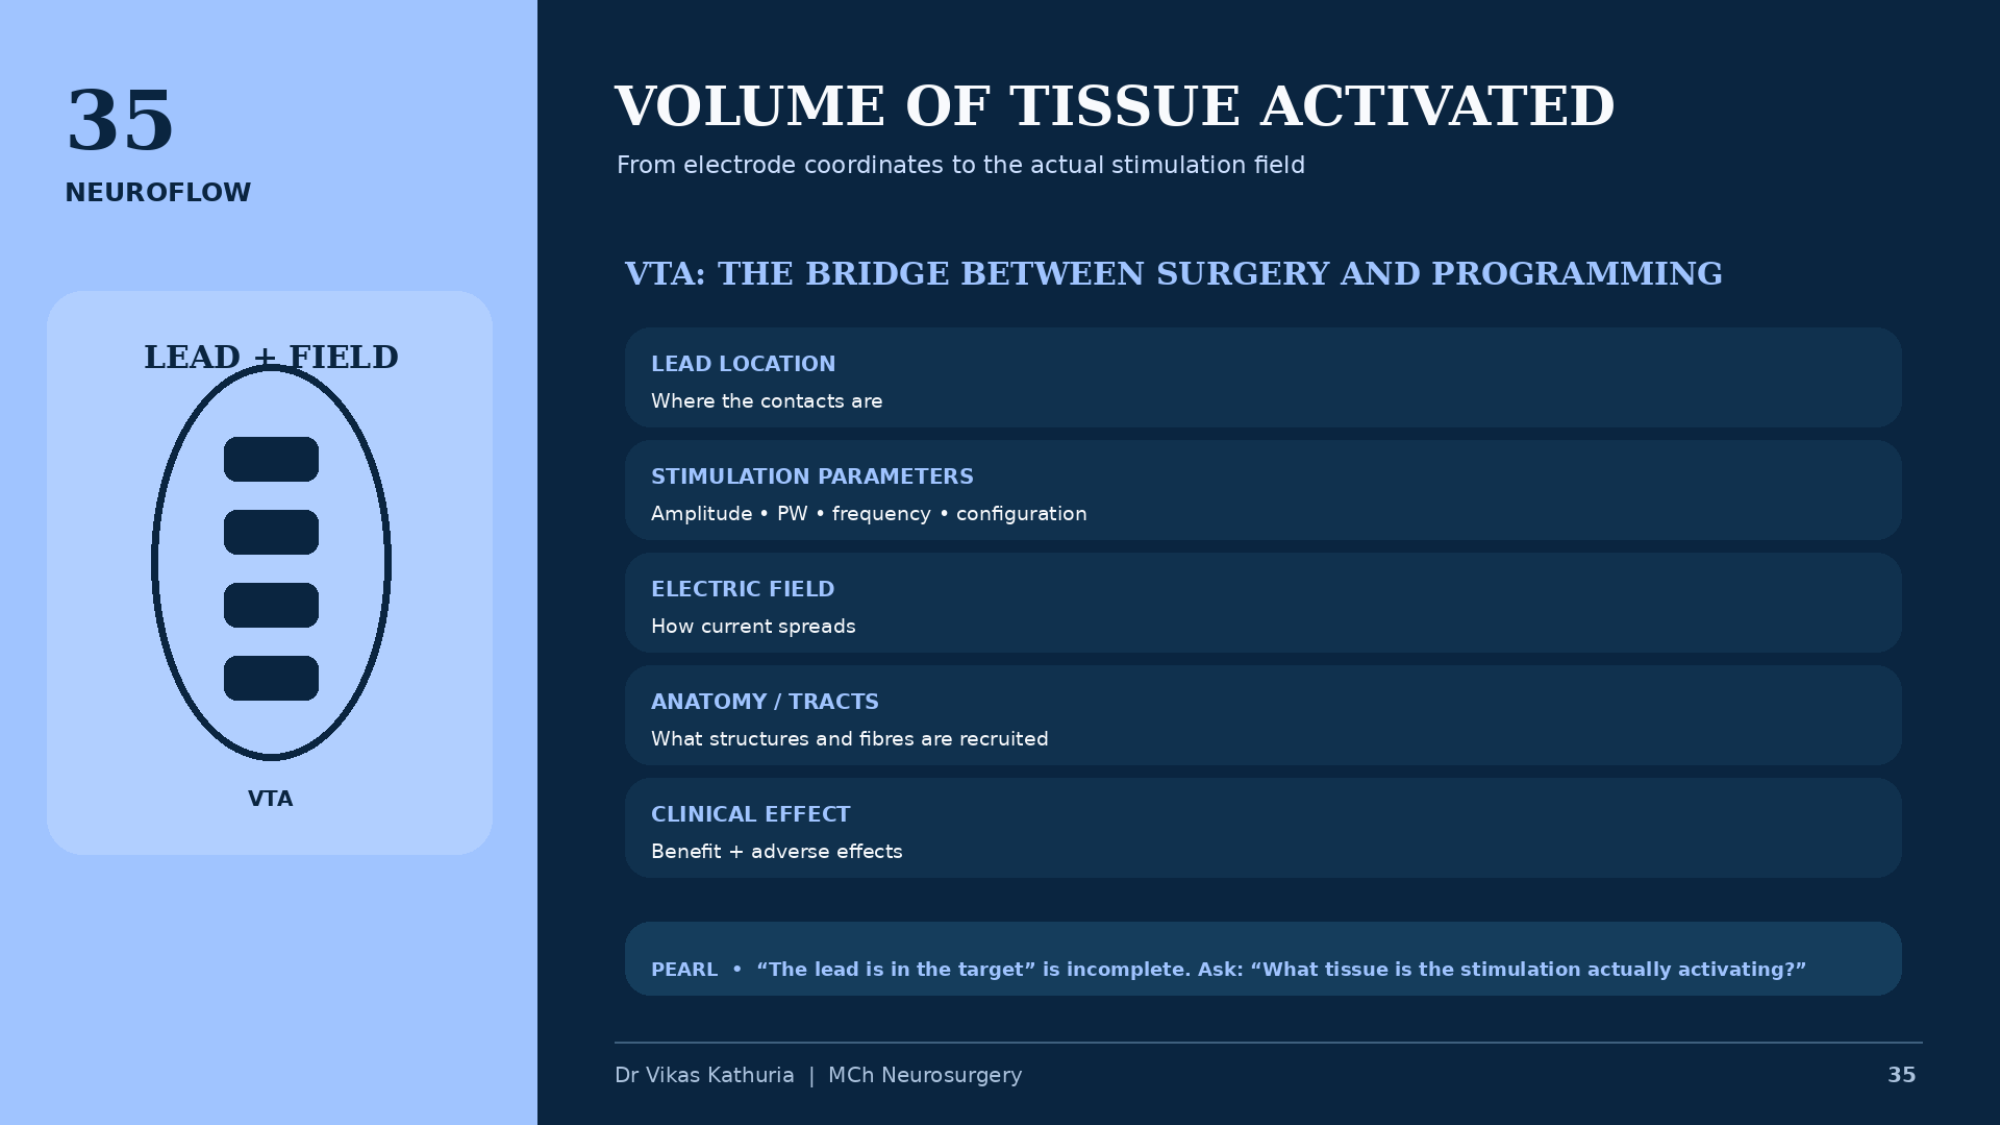
VOLUME OF TISSUE ACTIVATED
- From electrode coordinates to the actual stimulation field
- LEAD + FIELD
- VTA
- VTA: THE BRIDGE BETWEEN SURGERY AND PROGRAMMING
- LEAD LOCATION — Where the contacts are
- STIMULATION PARAMETERS — Amplitude • PW • frequency • configuration
- ELECTRIC FIELD — How current spreads
- ANATOMY / TRACTS — What structures and fibres are recruited
- CLINICAL EFFECT — Benefit + adverse effects
- PEARL • “The lead is in the target” is incomplete. Ask: “What tissue is the stimulation actually activating?”
- Dr Vikas Kathuria | MCh Neurosurgery
Image placeholder
35A LEAD RECONSTRUCTION + VTA — INSERT AUTHENTIC IMAGE
Real clinical image required
Image typeVTA visualization
DescriptionAuthentic image-based lead reconstruction with modelled field, from an institutional or published dataset.
Clinical purposeSupport fellowship-level interpretation without fabricating imaging or tractography.
Suggested sourceINSERT AUTHENTIC CLINICAL / PUBLISHED IMAGE HERE (licensing confirmed)
Copyright statusSource and reproduction rights must be confirmed before use.
CaptionTo be written with the final image
AssociationModule 07 · Slide 35
Image placeholder
35B VTA PROGRAMMING VISUALIZATION — INSERT AUTHENTIC IMAGE
Real clinical image required
Image typeProgramming screenshot
DescriptionAnonymized programming-side field visualization. Label DEVICE-SPECIFIC EXAMPLE.
Clinical purposeSupport fellowship-level interpretation without fabricating imaging or tractography.
Suggested sourceINSERT AUTHENTIC CLINICAL / PUBLISHED IMAGE HERE (licensing confirmed)
Copyright statusSource and reproduction rights must be confirmed before use.
CaptionTo be written with the final image
AssociationModule 07 · Slide 35