100%
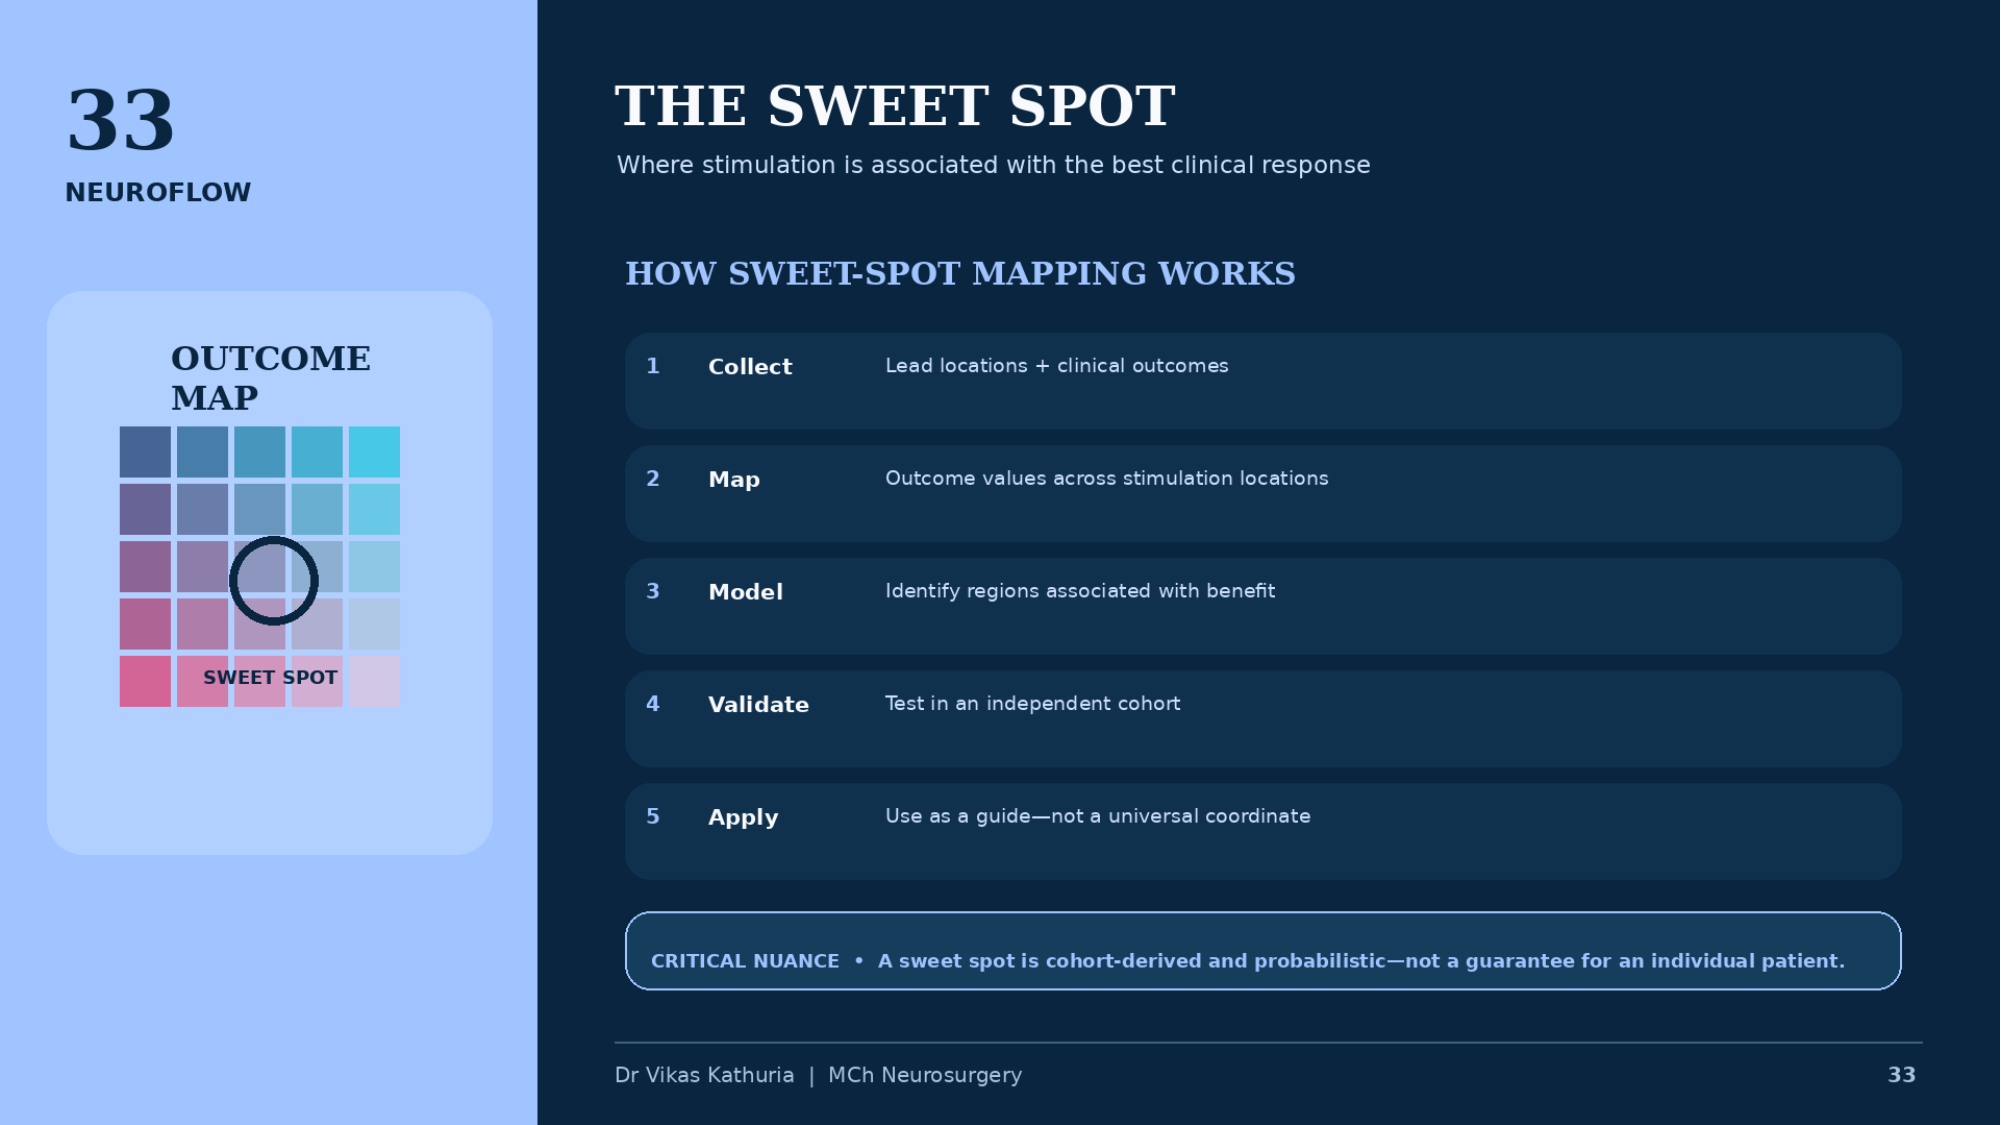
THE SWEET SPOT
- Where stimulation is associated with the best clinical response
- OUTCOME MAP
- SWEET SPOT
- HOW SWEET-SPOT MAPPING WORKS
- 1 Collect — Lead locations + clinical outcomes
- 2 Map — Outcome values across stimulation locations
- 3 Model — Identify regions associated with benefit
- 4 Validate — Test in an independent cohort
- 5 Apply — Use as a guide—not a universal coordinate
- CRITICAL NUANCE • A sweet spot is cohort-derived and probabilistic—not a guarantee for an individual patient.
- Dr Vikas Kathuria | MCh Neurosurgery
Image placeholder
33A SWEET-SPOT MAP FROM A PUBLISHED STUDY — INSERT AUTHENTIC IMAGE
Real clinical image required
Image typePublished trial figure
DescriptionPublished probabilistic outcome map, reproduced only with permission. Never generate a synthetic sweet-spot map.
Clinical purposeSupport fellowship-level interpretation without fabricating imaging or tractography.
Suggested sourceINSERT AUTHENTIC CLINICAL / PUBLISHED IMAGE HERE (licensing confirmed)
Copyright statusSource and reproduction rights must be confirmed before use.
CaptionTo be written with the final image
AssociationModule 07 · Slide 33